Speed vs Depth: The SOC Maturity Metric Your Board Actually Wants
Why MTTR measures activity, not maturity — and what to put on the dashboard instead.
Most SOC maturity dashboards measure speed. Mean Time to Detect, Mean Time to Respond, Mean Time to Remediate, percentage of incidents resolved at L1, false positive rate, alert closure rate. Every one of these is an activity metric. None of them measures whether the SOC is actually getting better at the thing it exists to do.
A SOC that detects an intruder fast — but only after the intruder has reached the database, exfiltrated the contents, and moved on — has an excellent MTTR and an underwater security posture. The dashboard tells one story. The breach report tells another.
There is a better metric, and it has been hiding in plain sight inside the Lockheed Cyber Kill Chain since 2011 and inside the MITRE ATT&CK framework since 2013.
What maturity should actually mean
Imagine two SOCs.
SOC A catches every attacker within four minutes of the first alert. The first alert always fires at Actions on Objectives — the adversary is already in the database. MTTR is excellent. The board is impressed.
SOC B catches every attacker at Initial Access. The adversary never makes it past the perimeter. MTTR for the few who do penetrate is ninety minutes — the alert is subtler, the investigation needs more work.
By any conventional maturity scorecard, SOC A is more mature. By any rational measure of business risk, SOC B is more mature.
SOC A is reactive by default. SOC B is proactive by design.
The disconnect is that conventional maturity metrics measure how quickly the SOC reacts to whatever it can detect. They do not measure how early the SOC can detect. The two are different questions and they have different answers.
The kill-chain progression as a maturity axis
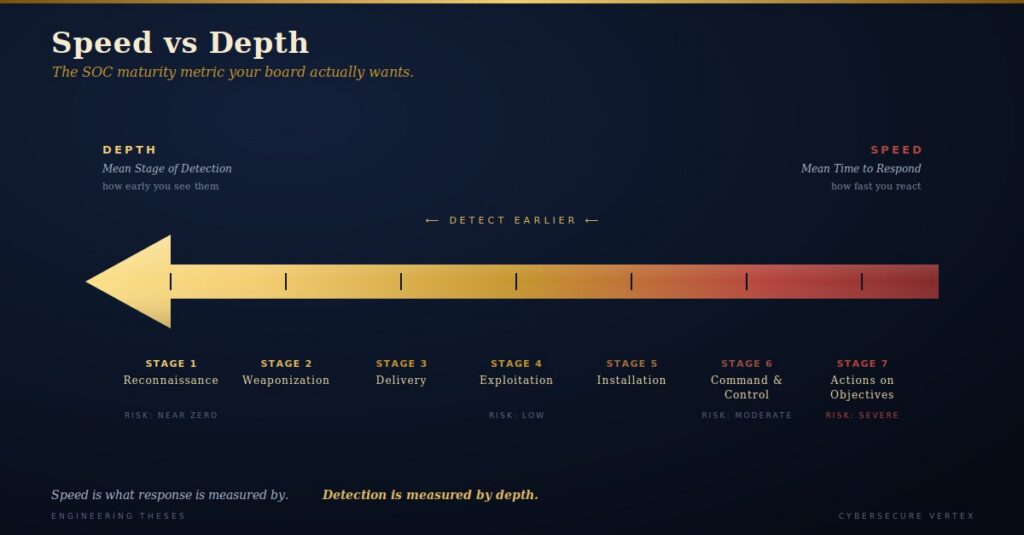
The Lockheed Cyber Kill Chain has seven stages, in order: Reconnaissance, Weaponization, Delivery, Exploitation, Installation, Command and Control, Actions on Objectives. MITRE ATT&CK covers the same conceptual progression at higher resolution across fourteen tactics. (I argued the relationship between the two frameworks at length in The Cyber Kill Chain Is Not Dead.)
The kill-chain progression is also, almost mechanically, a business-risk progression.
- Detect at Reconnaissance: the adversary is probing; no risk realised.
- Detect at Initial Access: the perimeter just validated itself; the adversary did not get in.
- Detect at Lateral Movement: they’re inside but haven’t reached the target; time is on your side.
- Detect at Actions on Objectives: the target is compromised; the question is now how much data they got.
The stage of detection is a direct proxy for the business risk that has already been realised when detection happens.
A SOC that consistently detects at Initial Access has lower realized risk than a SOC that consistently detects at Actions on Objectives. Whatever else they measure, this is the foundational difference.
Mean Stage of Detection
Let me propose a metric.
For each incident closed in a reporting period, label the kill-chain stage at which detection occurred. Aggregate the distribution. Compute the Mean Stage of Detection (MSD) — assign numeric values to stages (1 = Reconnaissance, 7 = Actions on Objectives) and average across the period. Lower is better.
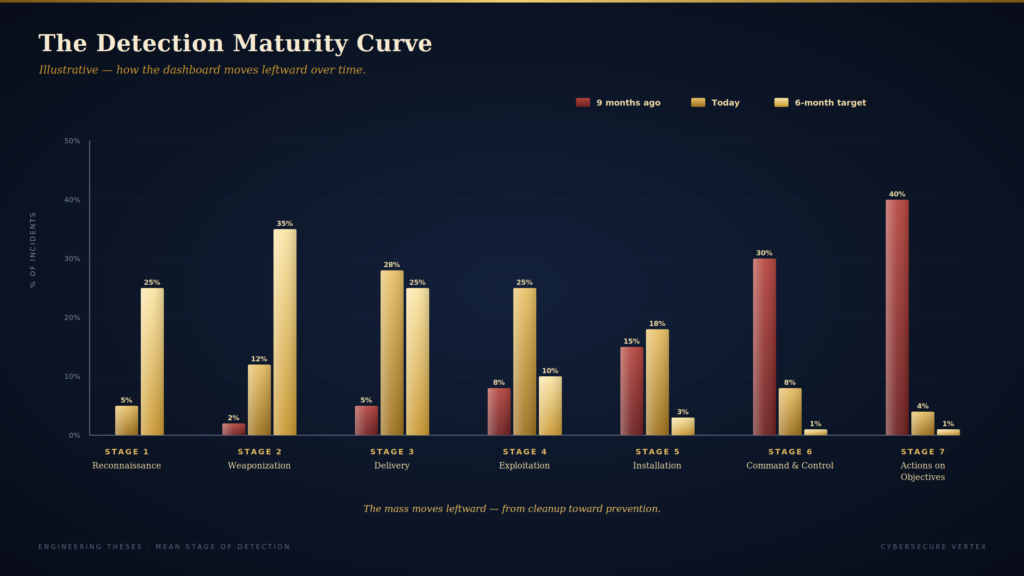
That’s the single number. Below it sits the full distribution — the Detection Maturity Curve — which shows where in the kill chain detection is actually happening across the SOC’s caseload.
Over time, you track three things:
Where is MSD heading? Trending down (leftward) means detection is shifting earlier in the adversary lifecycle. Trending up means the SOC is catching attackers later.
Where is the curve’s mode? If most incidents cluster at Stage 6 or 7, you are running a reactive SOC. If most are at Stage 2 or 3, you are running a preemptive one.
Where are the gaps? Stages with zero detections are either (a) stages adversaries never reach in your environment, or (b) blind spots in your detection coverage. Both are worth knowing; only one is alarming.
This is a metric the CISO can actually use.
What the CISO takes to the board
The board doesn’t want to hear MTTR. The board wants to hear narrative.
“Nine months ago, we were catching intruders at Stage 6 — Command and Control. By the time we knew about them, they had a persistent foothold and were communicating out. Today, we’re catching them at Stage 3 — Delivery. We see the malicious payload arrive at the inbox; it never reaches the endpoint. In six months, our target is Stage 1 — Reconnaissance. We will see adversaries scanning our perimeter before they have chosen a weapon.”
That is the CISO sentence. It is intelligible to a non-technical board. It is verifiable. It tells the board exactly what they want to know: are we getting better at protecting the business, or just faster at cleaning up after we don’t?
The slide that goes with it is the Detection Maturity Curve — a histogram showing the distribution of detections across kill-chain stages, with three bars: nine months ago, today, six-month target. The leftward shift across the three bars is the story. Every board member who has ever read a metric will understand it.
Mapping to business-risk posture
The leftward shift is not abstract. It maps directly to realized risk.
Detection at Stages 1-2 (Reconnaissance, Weaponization). The adversary is still in planning. Defensive action: harden the perimeter, monitor the scanner, possibly take legal action against confirmed reconnaissance. Risk realised: near zero. Compliance reporting: none.
Detection at Stages 3-4 (Delivery, Exploitation). The adversary attempted entry; defense fired. Perimeter validated. A user account or endpoint may have a stalled payload. Defensive action: contain, recover, investigate. Risk realised: low. Compliance reporting: rarely required.
Detection at Stages 5-6 (Installation, Command and Control). The adversary has a foothold and is communicating out. They have not yet reached the crown jewels but are establishing the path. Defensive action: aggressive containment, eviction, root-cause hunt. Risk realised: moderate to high. Compliance reporting: probable.
Detection at Stage 7 (Actions on Objectives). The adversary has reached or is reaching the target. Data is at risk or exfiltrating. Risk realized: severe. Mandatory reporting: almost certain.
MSD, in isolation, is a meaningful indicator of how exposed the business has been over the reporting period. Detection at Stage 2 across the quarter means the perimeter held.
Detection at Stage 6 across the quarter means the perimeter routinely failed and the SOC’s job was cleanup. Same SOC, same staff, same tooling — vastly different stories about what the security investment actually produced.
How to instrument this
Tagging every closed incident with a kill-chain stage is the only operational change required.
It can be done as part of the incident-closure workflow in any modern SIEM or SOAR:
The analyst, on closure, selects the kill-chain stage from a dropdown.
The stage is stored in a custom field.
Reporting aggregates the distribution monthly and quarterly.
For organisations already tagging MITRE ATT&CK techniques in incident records — most BFSI and regulated-industry SOCs are at least partially there — the stage can be derived from the MITRE tactic of the earliest-firing detection, collapsed to a kill-chain stage via the mapping established in The Cyber Kill Chain Is Not Dead.
This is one quarter’s worth of light tooling work. The metric arrives within ninety days. By quarter four, you have a trend. By quarter six, you have a story.
The limits, named honestly
MSD is directional, not perfect.
Not every incident traverses every stage. Supply-chain compromises and zero-days can land an adversary directly at Stage 4 or 5, skipping the earlier stages entirely. MSD calculated across heterogeneous incident types can be noisy if the SOC doesn’t separate the categories.
Not every detection is cleanly stageable. The earliest-firing rule may be ambiguous in its mapping to a kill-chain stage. Hold a stable convention or your trend line is junk.
MSD tells you whether you’re shifting leftward. It does not tell you everything about your detection programme. But it tells you something MTTR cannot — and that something is what the board actually wants to know.
Closing Thoughts
Detection engineering is not measured by speed. Speed is what response is measured by. Detection is measured by depth — how far back into the adversary's process you can see and act.
The Mean Stage of Detection is the metric your detection-engineering function should be evaluated against. It is what tells the CISO whether the function is earning its keep. It is what tells the board whether the security investment is shifting from cleanup to prevention.
Track it. Report it quarterly. Watch the curve move left.
The dashboard your CISO takes to the board this year should not be the same dashboard they took last year. If it is, the question is not how mature the SOC is. The question is whether anyone has been measuring the right thing.
— Damanjit Singh Uberoi · Founder, CyberSecure Vertex